
What Are Trump’s Chances Of Winning The GOP Primary?
What Are Trump’s Chances Of Winning The GOP Primary?
We did some back-of-the-envelope math.

ABC News Photo Illustration / REBA SALDANHA
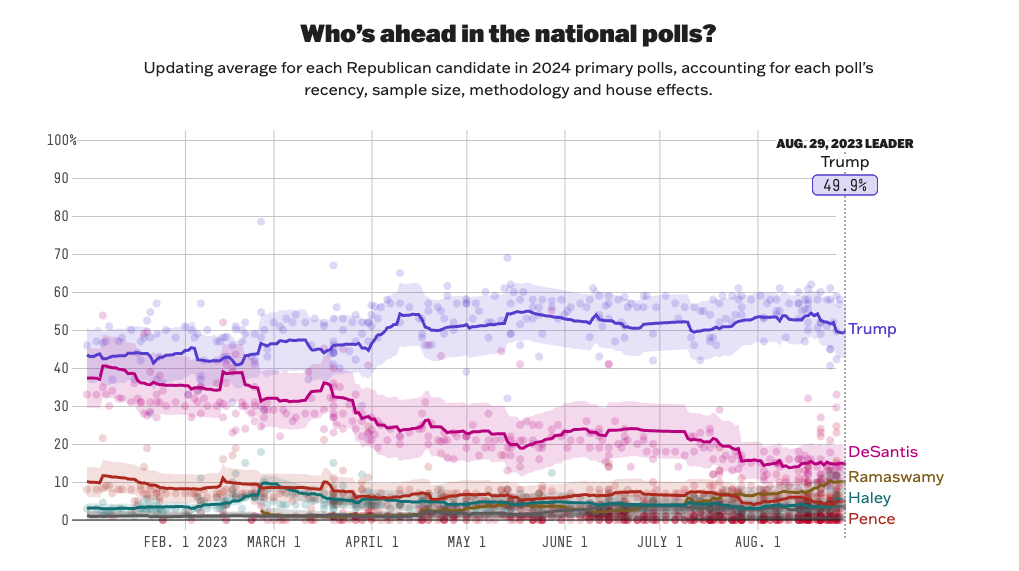
Is the 2024 Republican presidential primary already over? If you just look at the polls, you’d be forgiven for thinking so. Consider the state of the states: Several polls published last week showed former President Donald Trump leading in Iowa (with 42 percent to Florida Gov. Ron DeSantis’s 19 percent and South Carolina Sen. Tim Scott’s 9 percent), New Hampshire (at 50 percent versus DeSantis at 11 and businessman Vivek Ramaswamy at 10 percent) and South Carolina (at 48 percent versus 14 percent for both DeSantis and Scott). And in national polls, Trump currently has the support of 50 percent of GOP primary voters<a class="espn-footnote-link" data-footnote-id="1" href="https://fivethirtyeight.com/features/trump-chances-to-win-republican-primary/#fn-1" data-footnote-content="
All numbers in this article as of Tuesday at 2 p.m. Eastern.
“>1 — a slide of 2 percentage points since last Wednesday’s GOP primary debate, but still a commanding lead over his opponents.
Yet despite these dominant margins, our study of the history of primary polling suggests that it’s still too early to completely write off Trump’s competitors. Here at FiveThirtyEight, we are big believers in the predictive power of early election polling — where it is warranted. While we have found that early national polls tend to predict who will win primaries relatively well, there is a ton of volatility that prevents us from providing the type of clarity analysts want from forecasts. At this point in the 1992 Democratic primary, for example, future President Bill Clinton had not even announced his campaign. And at this point in the 2020 Democratic primary campaign, former South Bend, Indiana, Mayor Pete Buttigieg was garnering just 8 percent in polls of Iowa; come February, he won 25 percent of the popular vote in the caucuses.
To account for this uncertainty, I wrote a crude statistical model to translate national polling averages at this point in past campaigns into odds of winning presidential nominations. This model gives us a way of answering a key question of polling analysis: How durable is Candidate X’s lead given historical ranges of movement and measurement error in the polls? As of writing, this model gives Trump around a 78 percent chance of winning the nomination (sound familiar?) based on the polls. But there’s a lot of uncertainty surrounding how much we can trust surveys to produce a reliable signal in this primary — the biggest problem being that, historically, only a handful of candidates were polling around 50 percent nationally at this point in the cycle. Thanks to that small sample size, Trump’s “true” win probability<a class="espn-footnote-link" data-footnote-id="2" href="https://fivethirtyeight.com/features/trump-chances-to-win-republican-primary/#fn-2" data-footnote-content="
Meaning the probability that we could get if we ran the model with a different subset of candidates, or if our sample size of presidential candidacies was infinitely larger.
“>2 could be as low as 54 percent.
Trump is the heavy favorite in the GOP primary
Before getting into how the model works, let’s quickly take stock of the state of the race. Trump is currently at 50 percent in our average of national Republican primary polls. DeSantis, his closest competitor, is in a distant second place with 15 percent. Ramaswamy is currently enjoying a bit of a bounce: Over the last month, he has risen from 6 to 10 percent in national polls.
Trump’s lead is not only large; it’s also been extremely durable. This year, he has faced several scandals that we would expect to hurt his polling numbers. Yet, at least in the horse race, he has weathered the storm extremely well. After each of the four indictments handed down against him this year, Trump’s support in national polls has remained flat or even increased. All the while, his main opponent, DeSantis, has steadily lost ground.
To put the scale of Trump’s lead into perspective, I ran the early national polls of all presidential nomination contests since 1972 through our primary polling average model. During that span, only four non-incumbents (out of 124 for whom we have early national polling data) have polled at Trump’s level (50 percent) or better as of the end of August of the year before the election.
Early national polls loosely predict primary results
FiveThirtyEight’s retroactive average of national polls for non-incumbents running in presidential primaries from 1972 to 2020, as of the end of August before the election year, compared with their eventual share of the national popular vote
| Cycle▲▼ |
Party▲▼ |
Candidate▲▼ |
Winner?▲▼ |
Polling average in August before election year▲▼ |
Popular vote▲▼ |
|---|---|---|---|---|---|
| 1980 | D | Ted Kennedy | 66% | 37 | |
| 2000 | D | Al Gore | ✓ | 62 | 75 |
| 2016 | D | Hillary Clinton | ✓ | 55 | 56 |
| 1996 | R | Bob Dole | ✓ | 52 | 59 |
| 2024 | R | Donald Trump | 50 | TBD | |
| 2000 | R | George W. Bush | ✓ | 48 | 60 |
| 2008 | D | Hillary Clinton | 41 | 48 | |
| 1984 | D | Walter F. Mondale | ✓ | 41 | 38 |
| 1980 | D | Jimmy Carter | ✓ | 34 | 51 |
| 1988 | D | Gary Hart | 33 | 2 | |
| 1988 | R | George Bush | ✓ | 31 | 68 |
| 1976 | R | Gerald R. Ford | ✓ | 31 | 53 |
| 2000 | D | Bill Bradley | 30 | 21 | |
| 2020 | D | Joe Biden | ✓ | 29 | 52 |
| 1972 | D | Edmund Muskie | 28 | 12 | |
| 1980 | R | Ronald Reagan | ✓ | 28 | 61 |
| 2008 | R | Rudolph W. Giuliani | 26 | 3 | |
| 2016 | R | Donald Trump | ✓ | 25 | 45 |
| 1988 | R | Bob Dole | 25 | 19 | |
| 2004 | D | Joseph I. Lieberman | 25 | 2 | |
| 2008 | D | Barack Obama | ✓ | 24 | 47 |
| 1984 | D | John Glenn | 24 | 3 | |
| 1976 | R | Ronald Reagan | 23 | 46 | |
| 2016 | D | Bernie Sanders | 22 | 43 | |
| 1972 | D | Ted Kennedy | 21 | 0 | |
| 1980 | D | Jerry Brown | 20 | 3 | |
| 2012 | R | Mitt Romney | ✓ | 19 | 53 |
| 2008 | R | Fred Thompson | 19 | 1 | |
| 2008 | R | Tommy Thompson | 19 | 1 | |
| 2020 | D | Bernie Sanders | 17 | 26 | |
| 1972 | D | Hubert Humphrey, Jr. | 17 | 26 | |
| 2012 | R | Rick Perry | 17 | 0 | |
| 2020 | D | Elizabeth Warren | 16 | 8 | |
| 1988 | D | Jesse Jackson | 14 | 29 | |
| 2004 | D | Howard Dean | 14 | 6 | |
| 2008 | R | John McCain | ✓ | 13 | 47 |
| 1996 | R | Phil Gramm | 13 | 0 | |
| 2008 | D | John Edwards | 13 | 3 | |
| 2008 | R | Mitt Romney | 12 | 22 | |
| 1980 | R | Howard Baker | 12 | 1 | |
| 2004 | D | John Kerry | ✓ | 12 | 61 |
| 2016 | R | Jeb Bush | 12 | 1 | |
| 2004 | D | Richard A. Gephardt | 11 | 0 | |
| 1980 | R | John Connally | 10 | 1 | |
| 2012 | R | Michele Bachmann | 10 | 0 | |
| 1988 | R | Jack F. Kemp | 10 | 3 | |
| 2016 | R | Benjamin S. Carson | 9 | 3 | |
| 1988 | D | Michael S. Dukakis | ✓ | 8 | 43 |
| 1972 | D | John V. Lindsay | 8 | 1 | |
| 2012 | R | Ron Paul | 7 | 11 | |
| 1988 | D | Paul M. Simon | 7 | 4 | |
| 2016 | R | Ted Cruz | 7 | 25 | |
| 1984 | D | Alan Cranston | 7 | 0 | |
| 2016 | R | Marco Rubio | 6 | 11 | |
| 2004 | D | John Edwards | 6 | 19 | |
| 1988 | D | Richard A. Gephardt | 6 | 6 | |
| 2000 | R | Steve Forbes | 6 | 1 | |
| 2012 | R | Herman Cain | 6 | 0 | |
| 1984 | D | Jesse Jackson | 6 | 18 | |
| 1980 | R | Bob Dole | 6 | 0 | |
| 1996 | R | Patrick J. Buchanan | 5 | 21 | |
| 2020 | D | Pete Buttigieg | 5 | 2 | |
| 2016 | R | Mike Huckabee | 5 | 0 | |
| 2012 | R | Newt Gingrich | 5 | 14 | |
| 2000 | R | John McCain | 5 | 33 | |
| 1972 | D | Eugene J. McCarthy | 5 | 3 | |
| 2004 | D | Carol Moseley-Braun | 5 | 1 | |
| 2016 | R | Rand Paul | 4 | 0 | |
| 2016 | R | Carly Fiorina | 4 | 0 | |
| 2016 | R | John Richard Kasich | 4 | 14 | |
| 1972 | D | George S. McGovern | ✓ | 4 | 25 |
| 1988 | R | Pat Robertson | 4 | 9 | |
| 1992 | D | Bill Clinton | ✓ | 4 | 52 |
| 1980 | R | John Anderson | 4 | 12 | |
| 2008 | D | Bill Richardson | 3 | 0 | |
| 1988 | D | Al Gore | 3 | 14 | |
| 1992 | D | Paul E. Tsongas | 3 | 18 | |
| 2004 | D | Al Sharpton Jr. | 3 | 2 | |
| 1972 | D | Henry M. Jackson | 3 | 3 | |
| 1984 | D | Gary Hart | 3 | 36 | |
| 1984 | D | Reubin Askew | 3 | 0 | |
| 2008 | R | Mike Huckabee | 3 | 20 | |
| 2016 | R | Chris Christie | 3 | 0 | |
| 1988 | D | Bruce Babbitt | 2 | 0 | |
| 2020 | D | Cory A. Booker | 2 | 0 | |
| 1980 | R | George Bush | 2 | 23 | |
| 2004 | D | Dennis J. Kucinich | 2 | 4 | |
| 2012 | R | Jon M. Huntsman, Jr. | 2 | 0 | |
| 2008 | R | Ron Paul | 2 | 6 | |
| 1980 | R | Philip Crane | 2 | 1 | |
| 2000 | R | Orrin G. Hatch | 2 | 0 | |
| 2012 | R | Rick Santorum | 2 | 20 | |
| 1988 | R | Pete du Pont | 2 | 0 | |
| 1992 | D | Tom Harkin | 2 | 1 | |
| 1972 | D | Wilbur Daigh Mills | 2 | 0 | |
| 2020 | D | Andrew Yang | 2 | 0 | |
| 2000 | R | Gary L. Bauer | 2 | 0 | |
| 2016 | D | Martin O’Malley | 2 | 0 | |
| 1996 | R | Lamar Alexander | 2 | 3 | |
| 2008 | R | Tom Tancredo | 2 | 0 | |
| 2000 | R | Alan Keyes | 2 | 5 | |
| 2008 | R | Sam Brownback | 2 | 0 | |
| 2008 | D | Dennis J. Kucinich | 1 | 0 | |
| 2020 | D | Tulsi Gabbard | 1 | 1 | |
| 2008 | D | Joe Biden | 1 | 0 | |
| 2016 | R | Rick Santorum | 1 | 0 | |
| 2020 | D | Amy Klobuchar | 1 | 1 | |
| 1984 | D | Ernest F. Hollings | 1 | 0 | |
| 2020 | D | Deval Patrick | 1 | 0 | |
| 1992 | D | Bob Kerrey | 1 | 2 | |
| 1996 | R | Richard G. Lugar | 1 | 1 | |
| 2020 | D | Julián Castro | 1 | 0 | |
| 2012 | R | Gary Johnson | 1 | 0 | |
| 2012 | R | Buddy Roemer | 1 | 0 | |
| 2008 | D | Mike Gravel | 1 | 0 | |
| 2008 | R | Duncan Hunter | 1 | 0 | |
| 2020 | D | Marianne Williamson | 1 | 0 | |
| 2020 | D | Tom Steyer | 1 | 1 | |
| 2016 | R | Lindsey Graham | 1 | 0 | |
| 2020 | D | John K. Delaney | 0 | 0 | |
| 2020 | D | Michael Bennet | 0 | 0 | |
| 2016 | R | George Pataki | 0 | 0 | |
| 2016 | R | James S. Gilmore III | 0 | 0 | |
| 2020 | D | Joe Sestak | 0 | 0 | |
| 2008 | D | Christopher J. Dodd | 0 | 0 | |
| 2020 | D | Michael Bloomberg | 0 | 7 |
The most recent was former Secretary of State Hillary Clinton, who in August 2015 was polling at 55 percent nationally. She won about the same share of the cumulative popular vote for the Democratic primaries and caucuses that year. Before that was former Vice President Al Gore. In August 1999, Gore was polling at 62 percent among Democratic primary voters. His only opponent, former New Jersey Sen. Bill Bradley, was at that time polling at 30 percent. Bradley pitched himself as the liberal alternative to Gore — but in a party that had just happily seen eight years of a Clinton presidency, Gore was practically a shoo-in and ended up winning 75 percent of the national popular vote.
At this point in the 1996 Republican presidential campaign, former Senate Majority Leader Bob Dole was polling at 52 percent. His closest opponent, former Texas Sen. Phil Gramm, was polling 39 percentage points lower — almost the exact margin Trump enjoys today. Dole went on to win the Iowa caucuses just 26 percent to 23 percent over Pat Buchanan, a conservative commentator who was by then roughly tied for third place nationally with Gramm (who won just 9 percent in Iowa), according to our historical polling averages.
Finally, there is former Sen. Ted Kennedy, who ran for the Democratic presidential nomination against incumbent President Jimmy Carter in 1980. In August 1979, he was polling at 66 percent among Democratic voters, according to our average. But due to baggage from an earlier scandal, Kennedy failed to perform well in early primaries and won just 37 percent of the cumulative popular vote in primaries and caucuses the next year. Of the four top-polling candidates since 1972, his was the largest lead in late summer before the election year — and he is also the only one to lose the nomination.
That track record suggests Trump has a good chance of winning the nomination. We can use a logistic regression model to estimate a presidential candidate’s chances of winning their party’s nod given their off-year August polling numbers. Based on that model, a generic presidential candidate polling at Trump’s level today would have about a 78 percent chance of winning their party’s nomination. Those are good odds, but not a sure thing. (For reference, an 80 percent chance is just a little better than Clinton had in the final weeks of the 2016 general election.)
But there’s still an opening for someone else
Of course, in part due to small sample size, primaries are notoriously hard to predict. The method I used to run the model<a class="espn-footnote-link" data-footnote-id="3" href="https://fivethirtyeight.com/features/trump-chances-to-win-republican-primary/#fn-3" data-footnote-content="
A program for Bayesian statistics called Stan. Similar to frequentist statistical techniques such as bootstrapping, Stan gives you a distribution of the possible values of your parameter of interest (in our case, the probability a candidate polling at 50 percent would win the nomination) given the uncertainty of the data in our model.
“>3 itself produces a wide range of possible outcomes — the probability of Trump winning could reasonably range<a class="espn-footnote-link" data-footnote-id="4" href="https://fivethirtyeight.com/features/trump-chances-to-win-republican-primary/#fn-4" data-footnote-content="
Within the 90-percent Bayesian predictive interval.
“>4 from 54 percent to 93 percent — just based on the uncertainty in past polling! Moreover, forecasting the primary is likely to be especially difficult this year, since the events of this nomination are far removed from the events of history, meaning our models are less reliable.<a class="espn-footnote-link" data-footnote-id="5" href="https://fivethirtyeight.com/features/trump-chances-to-win-republican-primary/#fn-5" data-footnote-content="
As a general rule, uncertainty grows as you exceed the range of observed values in your dependent variable.
“>5 For instance, Trump is effectively running in the primary as an incumbent president, a rare event in general, but especially considering the circumstances under which he left office. Not to mention, no other leading presidential candidate has been under four criminal indictments while running for office. Betting markets — which have the advantage of looking at data other than polling — put Trump’s chances closer to 66 percent.
There is a big difference, however, between a likely event and a sure thing. Trump’s odds of winning today are close to what we would call “likely” or “probable” rather than “certain” or “highly likely.” Believe it or not, there’s still a decent shot one of his rivals could win.
Based on where they’re polling today, my crude model says DeSantis and Ramaswamy have a 13 percent<a class="espn-footnote-link" data-footnote-id="6" href="https://fivethirtyeight.com/features/trump-chances-to-win-republican-primary/#fn-6" data-footnote-content="
Predictive interval: 8-20 percent.
“>6 and 8 percent<a class="espn-footnote-link" data-footnote-id="7" href="https://fivethirtyeight.com/features/trump-chances-to-win-republican-primary/#fn-7" data-footnote-content="
Predictive interval: 5-14 percent.
“>7 chance, respectively, of winning the nomination as of today. The other of Trump’s competitors currently polling above 1 percent in our national average — former U.N. Ambassador Nikki Haley, former Vice President Mike Pence, former New Jersey Gov. Chris Christie and Scott— have around a 4-5 percent chance each.
If one of Trump’s competitors takes the lead, it’s likely they’ll do so by scoring some key upsets in the early-voting states. They may look at Trump’s numbers in Iowa, New Hampshire and South Carolina somewhat optimistically; Trump is somewhat weaker in those states than he is nationally. DeSantis is a natural candidate for an upset; last week, a FiveThirtyEight/Washington Post/Ipsos poll found that 51 percent of Republicans said they are still considering voting for him. Moreover, among Republicans, the Florida governor is viewed just about as favorably as Trump, if you adjust for the share of Republicans who don’t have an opinion of him.<a class="espn-footnote-link" data-footnote-id="8" href="https://fivethirtyeight.com/features/trump-chances-to-win-republican-primary/#fn-8" data-footnote-content="
I did this by dividing the percent who view him favorably by the sum of his favorability and unfavorability numbers.
“>8 The cases for Ramswamy and Scott also revolve around those ratings; both men have strong net favorability ratings despite a majority of Republicans having yet to form an opinion of them. Still, this goodwill only provides the foundation for a bump in the polls, not the catalyst for one.
Make no mistake: Trump will be hard for his Republican opponents to beat. He has a broad base of support and a smaller but intensely devoted group of followers who think he can do no wrong. But he is not inevitable.